
TL;DR:
- Continuous, structured competitor benchmarking reveals performance gaps and drives measurable improvements.
- AI automation significantly reduces analysis time and enhances data accuracy for enterprise benchmarking.
- Focusing on key metrics and proactive monitoring prevents strategic traps and supports competitive advantage.
73% of data-driven benchmarking companies report improved ROI, yet most operations teams still treat competitor benchmarking as a quarterly report someone files and forgets. That is a costly mistake. Competitor benchmarking is the ongoing engine that tells you where your operations stand, where rivals are pulling ahead, and exactly which gaps are costing you margin. For operations managers and executives running complex enterprise workflows, this discipline is not optional. It is the difference between reactive firefighting and deliberate, measurable performance improvement. This article covers definitions, types, step-by-step methodology, AI-powered applications, and the pitfalls that derail even well-resourced teams.
Table of Contents
- What is competitor benchmarking?
- Types of competitor benchmarking
- How competitor benchmarking works: Frameworks and steps
- Unlocking ROI with AI-driven benchmarking
- Pitfalls and expert advice for operations leaders
- Our perspective: Why most enterprises miss the real power of benchmarking
- Unlock enterprise performance with automated benchmarking
- Frequently asked questions
Key Takeaways
| Point | Details |
|---|---|
| Benchmark for measurable ROI | Systematic competitor benchmarking leads to higher performance gains and ROI for enterprises. |
| Choose the right type | Competitive benchmarking delivers the greatest impact compared to other types. |
| Leverage AI automation | AI-driven benchmarking increases accuracy and efficiency while enabling continuous improvement. |
| Avoid common pitfalls | Successful benchmarking focuses on the right metrics, continuous action, and innovation—not just imitation. |
What is competitor benchmarking?
Competitor benchmarking is, at its core, a measurement discipline. Formally, it is the systematic process of measuring a company’s performance metrics, processes, or strategies against competitors or industry leaders using quantifiable data. The word systematic is doing a lot of work in that definition. Without a repeatable structure, you are not benchmarking. You are guessing.
Before going further, it helps to clear up what benchmarking is not:
- Competitor analysis: Examines strategies, positioning, and qualitative factors. Benchmarking is quantitative.
- Market research: Focuses on customer needs and market size, not internal performance gaps.
- Imitation: Copying a rival’s product or process without measuring whether it fits your operations.
- One-time audits: Benchmarking is continuous. A single snapshot has limited operational value.
Here is how these three concepts compare at a glance:
| Approach | Primary focus | ROI potential | Innovation risk |
|---|---|---|---|
| Competitor benchmarking | Quantified performance gaps | High | Low to moderate |
| Competitor analysis | Strategic and qualitative factors | Moderate | Low |
| Imitation | Copying outputs | Variable | High |
“Organizations that benchmark systematically against competitors consistently achieve 10% or more improvement in key metrics compared to teams relying solely on internal performance reviews.”
That gap compounds over time. A 10% improvement in order cycle time, billing accuracy, or procurement efficiency is not a rounding error. At enterprise scale, it translates directly to margin and competitive positioning.
Types of competitor benchmarking
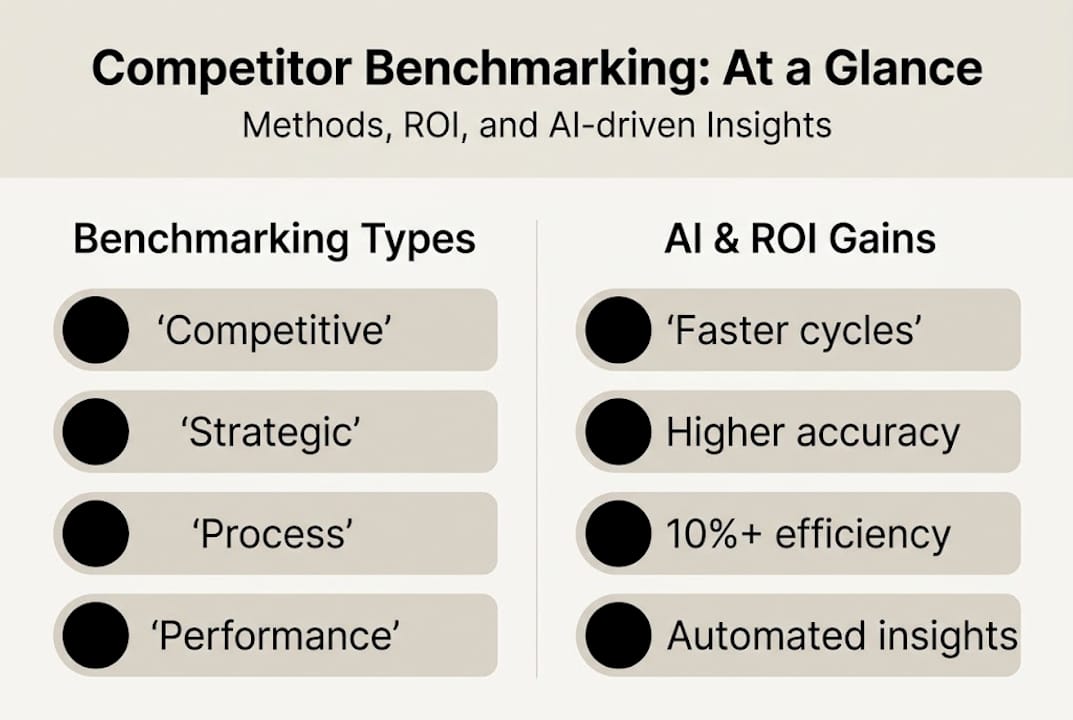
Not all benchmarking serves the same purpose. Key types include competitive, strategic, process, performance, and internal benchmarking, and choosing the right one depends on your specific operational challenge.
Here is a comparison of each type, including typical metrics and expected performance gains:
| Type | Sample metrics | Typical gain | Best for |
|---|---|---|---|
| Competitive | NPS, win rate, revenue growth | 10%+ | Direct market positioning |
| Strategic | Business model, market share | 5-15% | Long-term planning |
| Process | Cycle time, error rate, throughput | 8-20% | Operational efficiency |
| Performance | KPIs, cost per unit, inventory turnover | 10-18% | Finance and ops alignment |
| Internal | Department-to-department metrics | Up to 10% | Scaling best practices internally |
When should you use each type? Here is a practical guide:
- Competitive benchmarking: Use when you need to understand why a direct rival is winning deals or retaining customers at a higher rate.
- Strategic benchmarking: Use during annual planning cycles when you are evaluating business model changes or entering new markets.
- Process benchmarking: Use when a specific workflow (procurement, billing, approvals) is underperforming relative to industry norms.
- Performance benchmarking: Use when your finance and operations teams need a shared language around KPI targets.
- Internal benchmarking: Use first, before external efforts, to establish a reliable baseline and identify internal best practices worth scaling.
Competitive benchmarking consistently delivers the highest gains because it forces direct comparison on the metrics that actually drive revenue and retention. Internal benchmarking, while valuable, tends to plateau because it only surfaces what already exists inside your organization.
How competitor benchmarking works: Frameworks and steps
Knowing the types is one thing. Executing benchmarking in a way that produces actionable results for enterprise operations is another. Methodologies involve defining objectives and competitive set, collecting data, analyzing gaps, implementing actions, and monitoring continuously, with popular frameworks including matrices and SWOT/VRIO analysis.
Here is a practical five-step process:
- Define objectives: Tie benchmarking to a specific operational outcome. Reducing invoice processing time by 20% is a goal. “Understanding competitors” is not.
- Select your competitive set: Aim for 3 to 5 direct competitors and 10 to 15 key metrics. Broader than that and the analysis loses focus.
- Collect data: Use public filings, customer reviews, industry reports, job postings, and AI-powered tools. Mix quantitative sources with qualitative signals.
- Analyze gaps and build an action plan: Identify where you are behind, where you are ahead, and where the gap is large enough to act on immediately.
- Monitor continuously: Benchmarking is not a project with an end date. Build quarterly review cycles into your planning calendar.
For teams exploring how data-driven measurement connects to revenue, marketing attribution strategies offer a useful parallel for tying operational inputs to measurable outputs.
Common pitfalls to avoid at each stage:
- Data asymmetry: Rivals do not share internal numbers. You are often working with proxies. Acknowledge the limitations.
- Metric bias: Choosing metrics where you already perform well produces flattering but useless benchmarks.
- Imitation risk: Identifying a gap does not mean copying the competitor’s approach. Context matters enormously.
Pro Tip: Tie your benchmarking cycle to your annual and quarterly planning rhythms. And once a year, benchmark your benchmarking process itself. Are the metrics you track still the ones that matter most to your business model?
For teams also evaluating inbound marketing cost savings, the same discipline of structured measurement applies directly to demand generation performance.
Unlocking ROI with AI-driven benchmarking
Traditional benchmarking is labor-intensive. Analysts spend 18 to 25 hours per cycle pulling data from disparate sources, normalizing it, and building reports that are already partially outdated by the time leadership reviews them. AI-driven automation reduces this to 2 to 3 hours per cycle, boosts benchmark accuracy to 90%, and improves data completeness to 95%.

That is not an incremental improvement. It is a structural shift in what benchmarking can do for enterprise operations.
Three specific ways AI transforms the benchmarking function:
- Broader data source coverage: AI tools ingest pricing pages, job postings, patent filings, social sentiment, and third-party databases simultaneously, giving you a richer competitive picture than manual research ever could.
- Continuous updates: Instead of quarterly snapshots, AI-powered benchmarking delivers rolling updates. You see competitive shifts as they happen, not three months later.
- Workflow automation: Automated pipelines eliminate the manual data cleaning, normalization, and report generation that consume analyst time and introduce human error.
The ROI case is compelling across industries. Retail and e-commerce operations using AI benchmarking have reported inventory turnover improvements, revenue benchmark alignment, and in some cases marketing ROI gains exceeding 1,200% ROAS through better-targeted spend decisions informed by competitive data.
Pro Tip: You do not need a massive benchmarking program to see results. Start with one workflow, one competitor set, and one AI tool. Even focused efforts at this scale can yield up to 96% cost reduction in analysis time, which frees your team for higher-value interpretation and strategy work. For a broader view of how AI SEO tool innovations are reshaping competitive intelligence, the parallels to operational benchmarking are direct.
Pitfalls and expert advice for operations leaders
Even well-resourced teams make predictable mistakes. Benchmarking can fail due to data asymmetry, over-broad scopes, bias, and static approaches. Leading organizations avoid these traps by focusing on leading indicators and mixing qualitative and quantitative sources.
The five most common pitfalls, and how to fix each one:
- Data hiding: Competitors do not publish internal metrics. Fix this by triangulating from multiple proxy sources: job postings reveal hiring priorities, patent filings signal R&D direction, and pricing pages expose positioning shifts.
- Metric myopia: Tracking too many metrics dilutes focus. Fix this by selecting 10 to 15 metrics directly tied to your top three operational priorities.
- Static benchmarks: Running benchmarking once a year means you are always reacting. Fix this by building automated monitoring into your operations stack.
- Imitation over innovation: Closing a gap by copying a rival’s approach often just puts you at parity. Fix this by asking what the competitor’s approach reveals about customer needs, then solving that need differently.
- Over-complexity: Exhaustive benchmarking programs often stall under their own weight. Fix this by starting small, proving value, and expanding scope incrementally.
For teams working to connect benchmarking outputs to financial outcomes, understanding marketing ROI provides a practical framework for translating operational data into board-level language.
Expert advice: Pay attention to leading indicators, not just trailing ones. Hiring velocity, patent activity, and partnership announcements tell you where a competitor is heading. Revenue and NPS tell you where they have already been.
Pro Tip: A focused benchmarking effort covering three competitors and eight key metrics consistently outperforms exhaustive programs covering 20 competitors and 50 metrics. Constraint forces clarity.
Our perspective: Why most enterprises miss the real power of benchmarking
Most organizations approach competitor benchmarking with one question: where are we behind? That is the wrong starting point. The most valuable insight benchmarking produces is often the opposite: where should we not follow our rivals?
We have seen enterprise teams invest heavily in closing gaps that turned out to be strategic traps. A competitor’s low pricing, fast delivery promise, or aggressive hiring pace may look like a benchmark to chase. But without understanding the cost structure or customer segment behind those numbers, you are optimizing toward someone else’s constraints.
The organizations that consistently outperform their markets use benchmarking differently. They identify where rivals are converging and deliberately build capability in a different direction. AI makes this possible at scale. When you can monitor competitive signals continuously, you stop playing catch-up and start setting the benchmarks others will eventually chase.
The shift from reactive to proactive benchmarking is not a technology question. It is a mindset question. For teams ready to explore how AI tool comparison informs smarter competitive intelligence, the tools are already there. The question is whether your organization is using them to close gaps or to create new ones.
Unlock enterprise performance with automated benchmarking
If this article made one thing clear, it is that effective competitor benchmarking requires structure, consistency, and increasingly, AI-powered automation to stay ahead of fast-moving markets.
Nimblo.ai deploys embedded automation pods directly into your operations, combining AI engineers, workflow architects, and domain experts to build benchmarking and performance monitoring systems that run continuously, not quarterly. Teams using Nimblo’s approach reduce manual analysis time dramatically, improve data accuracy, and get ongoing expert support throughout a structured 120-day engagement. If you are ready to move from static reports to live competitive intelligence, explore Nimblo.ai’s $99 pilot offer and see measurable results within weeks.
Frequently asked questions
What is the difference between competitor benchmarking and competitor analysis?
Competitor benchmarking quantifies performance gaps using structured data, while competitor analysis examines strategies and qualitative factors like positioning and messaging. Benchmarking tells you how far behind you are; analysis tells you why.
Which competitor benchmarking type delivers the most ROI?
Competitive benchmarking, which measures your performance directly against rivals on core KPIs, delivers over 10% gains more reliably than other types because it forces comparison on the metrics that directly drive revenue and retention.
How does AI-driven benchmarking improve efficiency?
AI cuts benchmarking time from 18 to 25 hours per cycle down to 2 to 3 hours, while improving data completeness to 95%. This makes continuous performance tracking operationally feasible for enterprise teams without adding headcount.
What are common pitfalls to avoid in benchmarking?
The most damaging pitfalls are data asymmetry, metric myopia, and static analysis. Avoid copying competitors blindly and resist the urge to track every available metric. Focused, continuously updated benchmarking consistently outperforms exhaustive one-time efforts.