
Finding the right SEO reporting tools can feel overwhelming when every platform promises more features and bigger dashboards. For Florida small business owners, tracking the metrics that actually matter means less stress and more focus on growth. By starting with foundational SEO concepts and using accessible solutions like Google Search Console, you get clear traffic insights without juggling multiple expensive platforms. This guide helps you set up effective reporting, organize data, and share actionable findings that drive real results for your team.
Table of Contents
- Step 1: Set Up SEO Reporting Tools Efficiently
- Step 2: Collect and Organize Relevant SEO Data
- Step 3: Analyze SEO Performance and Trends
- Step 4: Verify Report Accuracy and Insights
- Step 5: Share Actionable Findings with Your Team
Quick Summary
| Important Point | Explanation |
|---|---|
| 1. Set Up Essential Tools First | Begin with Google Search Console and Google Analytics to track SEO performance metrics relevant to your business goals. |
| 2. Organize Data Effectively | Collect and compile your SEO data into a centralized location like Google Sheets for easier tracking and analysis. |
| 3. Regularly Analyze Trends | Compare current metrics to past performance to identify traffic patterns and opportunities for improvement in your SEO strategy. |
| 4. Validate Data and Reporting | Ensure accuracy by cross-referencing metrics and verifying that your data collection methods are consistent and reliable. |
| 5. Share Findable Actionable Insights | Tailor your findings for different stakeholders and present clear action steps to foster understanding and motivate implementation. |
Step 1: Set Up SEO Reporting Tools Efficiently
Setting up your reporting tools properly from day one saves time and prevents headaches down the road. You’ll want to focus on the right metrics for your business before you get overwhelmed with data.
Start by understanding foundational SEO concepts like technical SEO, on-page optimization, and off-page strategies. This foundation helps you choose tools that actually track what matters for your business, not just vanity metrics.
Here’s what most Florida SMB owners prioritize when setting up reporting:
- Connect Google Search Console to see how your site performs in search results
- Link Google Analytics to track visitor behavior and conversions
- Choose a primary reporting tool that consolidates your data into one dashboard
- Configure custom reports that match your business goals
- Set baseline metrics so you can measure progress over time
Start with the tools you already have access to before buying expensive platforms—Google’s free tools often give you everything you need initially.
Before selecting a platform, think about what your team actually needs. Are you tracking local search visibility for multiple locations? Monitoring blog traffic? Watching competitor rankings?
You don’t need every feature available. Pick a tool with the specific features you’ll use weekly. Comparing SEO tools for small businesses helps you find solutions that match your actual workflow, not just your wishlist.
Next, create a simple data structure. Decide which metrics you’ll pull weekly, monthly, and quarterly. This prevents analysis paralysis and keeps your reporting consistent.
Set up automated exports or dashboard alerts where possible. If your tool can automatically send you weekly summaries, you’ll spend less time digging through dashboards and more time acting on insights.
Here’s a snapshot of how common SEO reporting metrics inform business strategy:
| Metric | What It Measures | Why It Matters for SMBs |
|---|---|---|
| Organic Traffic | Visitors from search engines | Shows growth in site visibility |
| Conversion Rate | Leads or sales per visit | Indicates effectiveness of content |
| Keyword Rankings | Search positions for terms | Reveals brand exposure for priorities |
| Click-Through Rate (CTR) | % of searchers who click | Uncovers title/description effectiveness |
| Bounce Rate | One-page visits percentage | Flags issues with content relevance |
Pro tip: Start with three core metrics only—organic traffic, conversions from organic, and keyword rankings for your top 10 terms. Add more metrics once these flow smoothly into your reporting routine.
Step 2: Collect and Organize Relevant SEO Data
Data collection is where strategy meets action. You’ll gather information about keywords, rankings, traffic, and technical performance, then organize it so you can actually use it.
Start by identifying what data matters most to your business. Are you focused on local search visibility? Blog traffic growth? Lead generation from organic search? Your goals determine which metrics you track.
Begin collecting data from these core sources:
- Google Search Console for keyword impressions and click-through rates
- Google Analytics for visitor behavior and conversion data
- Rank tracking tools for keyword position monitoring
- Backlink analysis tools to monitor your link profile
- On-page content audits to find optimization opportunities
The data itself isn’t valuable until it’s organized in a way your team can understand and act on.
Once you have data flowing in, create a centralized location for it. Many Florida SMBs use Google Sheets or a spreadsheet to compile weekly metrics from multiple sources. This takes 30 minutes weekly but saves hours of manual searching later.
Compare these data organization tools to find your best fit:
| Tool | Speed of Use | Collaboration Ability | Best For |
|---|---|---|---|
| Google Sheets | Fast and intuitive | Easy sharing, live editing | Small teams and SMBs |
| Excel | Moderate to fast | Limited unless cloud-based | Data analysis, offline use |
| BI Dashboards | Automated, real-time | High for all users | Scalability and visual analysis |
When collecting data about keywords, rankings, and traffic sources, organize it by the performance categories that matter to you. Group keywords by business goals, track rankings by location if you serve multiple areas, and separate organic traffic by page type.
Use column headers that make sense to your team. Instead of “KW Vol,” write “Monthly Search Volume.” Clear labels prevent confusion when team members review reports.
Set a consistent schedule for data collection. Weekly updates work best for most SMBs. Pull your numbers every Friday afternoon so you have fresh data for Monday strategy meetings.
If your reporting tool has dashboard functionality, take advantage of it. Visual dashboards make it easier to spot trends than spreadsheet rows. You’ll notice when something drops 20% without digging through numbers.
Document where each metric comes from. If your keyword rankings come from Tool A and your traffic data comes from Tool B, note that. This prevents confusion and catches data discrepancies faster.
Pro tip: Store your raw data separately from your analysis. Keep one spreadsheet with cleaned-up weekly snapshots for reporting, and maintain a master file with all historical data so you can calculate month-over-month and year-over-year changes.
Step 3: Analyze SEO Performance and Trends
Analyzing your data reveals what’s working and what needs adjustment. You’ll look for patterns, spot opportunities, and make decisions based on actual performance rather than guesses.

Start by comparing your current metrics to previous periods. Look at organic traffic from last month versus this month. Check keyword rankings to see which ones improved and which ones dropped. These comparisons tell you if your efforts are paying off.
Focus on these key performance areas:
- Organic traffic volume and source pages
- Keyword ranking positions for target terms
- Click-through rates from search results
- Conversion rates from organic visitors
- Technical issues affecting crawlability and indexing
Trends matter more than single data points. One week of high traffic means nothing. Three months of steady growth means everything.
When analyzing performance metrics and trends, identify which pages drive the most traffic and conversions. These are your winners. Double down on topics similar to your best performers.
Look for patterns in keyword performance. Do branded keywords rank higher than product keywords? Are local searches outperforming national ones? Your patterns reveal where your SEO strengths actually lie.
Compare your performance against competitors in your Florida market. If a competitor ranks for keywords you don’t target, that’s an opportunity. If they dropped in rankings, investigate why. Their mistakes become your learning opportunities.
Track seasonal trends. Many Florida service businesses see traffic spikes during specific seasons. Understanding your traffic cycles helps you plan content and campaigns around peak demand periods.
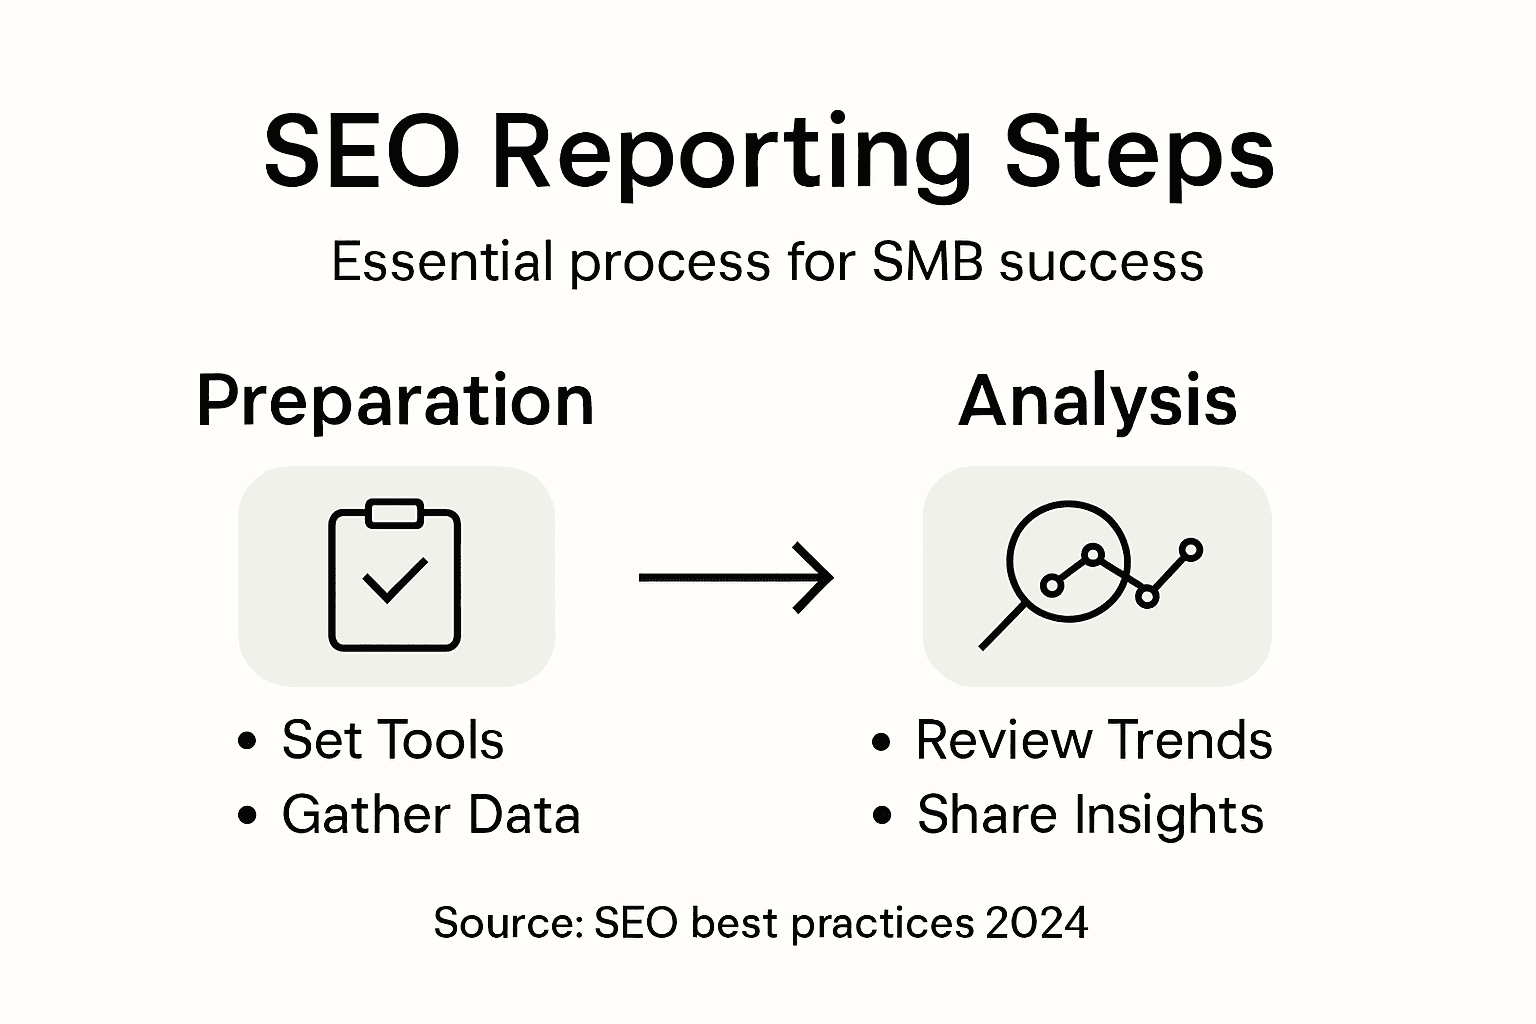
Use Google Search Console to identify high-impression keywords that don’t convert clicks. These are ranking opportunities. If you’re showing up in position 5 for 500 monthly searches but only getting 12 clicks, improving your title and description could dramatically increase traffic.
Identify technical issues that hurt rankings. Slow page speed, mobile usability problems, and crawl errors all suppress visibility. Fixing these issues often provides quick ranking improvements.
Set up monthly review sessions with your team. Pull your key metrics, discuss what changed, and decide on next month’s priorities. This keeps everyone aligned on what matters.
Pro tip: Create a simple one-page monthly summary showing your three best metrics, three areas needing improvement, and three action items for next month. This keeps analysis focused and actionable instead of lost in spreadsheet chaos.
Step 4: Verify Report Accuracy and Insights
Accurate reporting builds trust with your team and clients. You’ll double-check your data, validate your sources, and ensure your insights actually reflect what’s happening with your SEO.
Start by verifying that your data collection methods are consistent. If you pulled keyword rankings on Monday last week but Friday this week, your comparison is meaningless. Standardize when and how you collect each metric.
Use these verification steps:
- Compare metrics across multiple tools to spot discrepancies
- Check Google Search Console data against Google Analytics to ensure alignment
- Verify that crawl errors or technical issues are actually resolved
- Confirm keyword ranking positions by manually checking search results
- Validate that conversions are properly tracked in your analytics
A report that looks good but contains errors will damage your credibility faster than admitting you’re still investigating something.
When cross-referencing metrics and validating data collection methods, watch for common discrepancies. Traffic numbers might differ between Google Analytics and your reporting tool due to filter settings or timezone differences. Document these variances so you understand them.
Check for anomalies in your data. Did organic traffic suddenly spike 300 percent? Before celebrating, investigate why. Was there a major news mention? Did someone link to you? Or is it a tracking error?
Verify that your tools are properly configured. Untagged campaigns, misconfigured filters, or duplicate tracking can skew results. Spend 30 minutes quarterly reviewing your setup to catch configuration drift.
Manually spot-check ranking positions for your top keywords. Search Google for them yourself and note your actual position. Tool rankings sometimes lag or misreport due to localization factors.
Ensure technical issues are actually fixed before claiming victory. If your report shows you resolved crawl errors, verify in Google Search Console that new crawl errors haven’t appeared. Check that pages are still indexed properly.
Document your verification process. When someone questions your numbers, you can explain exactly how you validated them. This transparency builds confidence in your reporting.
Pro tip: Create a monthly verification checklist covering data collection consistency, tool alignment, anomaly investigation, and technical validation. Run through it before finalizing any report to catch errors before they reach stakeholders.
Step 5: Share Actionable Findings with Your Team
Sharing findings effectively transforms data into action. You’ll present your insights in a way that motivates your team to implement changes, not get lost in spreadsheets.
Start by understanding who needs what information. Your content creator needs different insights than your sales team. Your manager wants the executive summary. Tailor your message to each audience’s priorities.
Structure your findings around these key elements:
- What improved and what declined this period
- Why those changes happened based on your analysis
- Specific actions to take next
- Expected outcomes from those actions
- Timeline for implementation
Numbers without context are just noise. Numbers with a clear story and action plan drive results.
When tailoring findings to different audiences, keep explanations simple. Your technical SEO specialist might understand “crawl budget optimization,” but your sales team won’t. Use language everyone understands.
Create a one-page summary for executives. They want to know if organic traffic is up, if leads are increasing, and what comes next. Skip the technical details unless they ask.
Make visuals your secret weapon. A graph showing three months of traffic growth tells a story faster than 50 rows of data. Use charts for trends, dashboards for current status, and simple graphics to explain concepts.
Be brutally specific with recommendations. Instead of “improve content,” say “update the three blog posts driving the most traffic with fresh statistics and internal links to our service pages.” Specific beats vague every time.
Use plain language when communicating research findings to ensure everyone grasps your insights. Avoid SEO jargon. Replace “optimize meta descriptions” with “improve the preview text people see in Google search results.”
Assign owners to action items. “Improve page speed” is a suggestion. “Sarah will audit page speed and report findings by Friday” is a commitment. Clear ownership ensures things actually happen.
Schedule regular reporting meetings. Monthly works best for most teams. Consistency builds habits and keeps SEO top of mind.
End every presentation with a clear next step. What should your team do with this information? What’s the deadline? This prevents reports from becoming background noise.
Pro tip: Create a standard template with three sections: what happened, why it happened, and what we’re doing about it. Use the same format every month so your team knows exactly where to find the information they need.
Simplify Your SEO Reporting and Boost Local Growth Today
Mastering the SEO reporting process for SMBs uncovers common challenges like managing scattered data, tracking meaningful metrics, and turning analytics into clear action plans. If you find yourself struggling with disjointed tools, confusing reports, or time-consuming manual updates, you are not alone. Key goals include consolidating your SEO data, automating insights, and focusing on local SEO performance to capture your Florida market effectively.
That is where Nimblo.ai’s all-in-one platform offers a powerful solution. Designed specifically for Florida SMBs, it centralizes SEO reporting alongside website management, CRM, and automation features. You get fast setup combined with AI-powered local SEO, automated lead generation, and conversion-focused design — saving you hours of manual work while improving your visibility and conversions. Experience clear, actionable data dashboards and ongoing local support without juggling multiple costly tools.
Stop wasting time compiling reports from different sources. Take control with Nimblo.ai now and see how easy it becomes to track organic traffic, keyword rankings, and conversions all in one place. Start driving real results with a platform built for your unique SMB needs in Florida. Visit Nimblo.ai to get started today and transform your SEO reporting process for lasting growth.
Frequently Asked Questions
How do I set up SEO reporting tools for my small business?
To set up SEO reporting tools effectively, start by connecting Google Search Console and Google Analytics to track your site’s performance and visitor behavior. Then, choose a primary reporting tool and configure custom reports that align with your business goals. Aim to establish a routine for data collection every week to ensure consistency.
What metrics should I prioritize when mastering the SEO reporting process?
Focus on core metrics like organic traffic, conversion rates from organic visits, and keyword rankings for your top ten terms. By starting with these essential metrics, you can build a clear understanding of your SEO performance and adjust your efforts effectively.
How can I analyze my SEO performance trends over time?
To analyze SEO performance trends, compare your current metrics with previous periods, such as organic traffic volume and keyword rankings. Look for growth patterns or declines, and identify which content drives the most engagement, allowing you to optimize future strategies accordingly.
What steps can I take to verify my SEO report’s accuracy?
To verify your SEO report’s accuracy, ensure that data collection methods are consistent across all tools and check for any discrepancies between sources. Implement a standard verification checklist monthly to catch errors before finalizing any reports.
How can I share actionable insights from my SEO reports with my team?
Share actionable insights by tailoring your findings to suit the needs of different team members, focusing on key improvements and specific actions to take. Create visual aids to highlight trends and assign clear ownership for each task to ensure implementation and accountability.
What tools can help me collect and organize SEO data efficiently?
Use spreadsheets like Google Sheets or specialized dashboard tools to streamline data collection and organization. Organize data by performance categories that align with your business goals, making sure to establish a weekly collection schedule to maintain consistency.